Read the exam question below and study the charts, then answer these questions about the data
----- Nội dung dịch tự động từ ảnh -----
14
100-
90-
80
70
60-
50
40
30
20-
10-
0
Read the exam question below and study the charts, then answer these questions
about the data.
1 What is the main trend revealed in
the bar chart?
2 Which ten-year period showed the
first significant increase?
3 What happened in the ten-year
period after that?
4 What is the link between the two
charts?
5 In 2015, what percentage of people
were severely obese?
6 Which was the largest group in 2015?
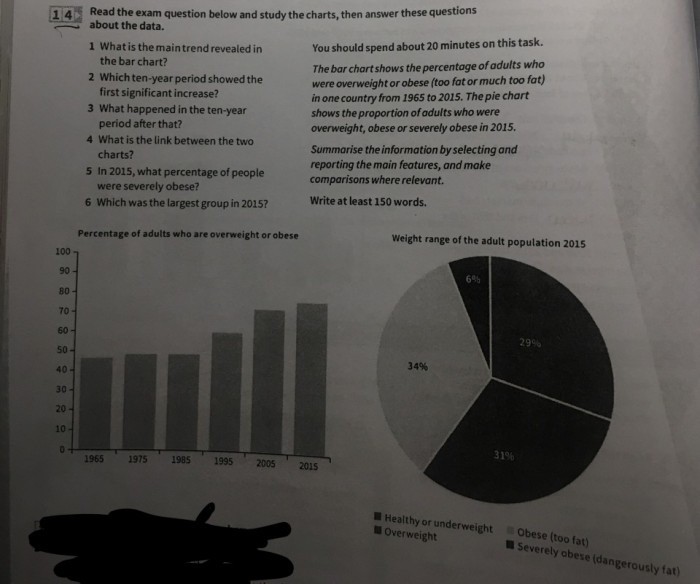
Percentage of adults who are overweight or obese
1965
1975
1985
1995 2005
You should spend about 20 minutes on this task.
The bar chart shows the percentage of adults who
were overweight or obese (too fat or much too fat)
in one country from 1965 to 2015. The pie chart
shows the proportion of adults who were
overweight, obese or severely obese in 2015.
Summarise the information by selecting and
reporting the main features, and make
comparisons where relevant.
Write at least 150 words.
2015
Weight range of the adult population 2015
34%
6%
31%
Healthy or underweight
Overweight
29%
Obese (too fat)
Severely obese (dangerously fat)
14
100-
90-
80
70
60-
50
40
30
20-
10-
0
Read the exam question below and study the charts, then answer these questions
about the data.
1 What is the main trend revealed in
the bar chart?
2 Which ten-year period showed the
first significant increase?
3 What happened in the ten-year
period after that?
4 What is the link between the two
charts?
5 In 2015, what percentage of people
were severely obese?
6 Which was the largest group in 2015?
Percentage of adults who are overweight or obese
1965
1975
1985
1995 2005
You should spend about 20 minutes on this task.
The bar chart shows the percentage of adults who
were overweight or obese (too fat or much too fat)
in one country from 1965 to 2015. The pie chart
shows the proportion of adults who were
overweight, obese or severely obese in 2015.
Summarise the information by selecting and
reporting the main features, and make
comparisons where relevant.
Write at least 150 words.
2015
Weight range of the adult population 2015
34%
6%
31%
Healthy or underweight
Overweight
29%
Obese (too fat)
Severely obese (dangerously fat)