Fill in the gaps with the words below shot up dramatically
Part 3: Fill in the gaps with the words below
shot up dramatically,has fallen,sharply, shows, between 1950 and 1970, compared to,changed, in conclusion
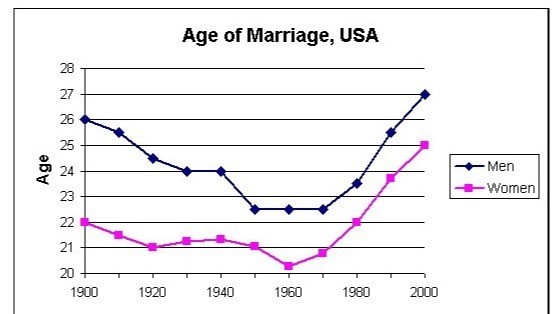
The graph (1)…………….. changes in the average age of marriage for men and women in the USA between 1900 and 2000. Overall, although both men and women are getting married later, the difference between them has decreased.
The biggest change was in the age of marriage for women. For the first 50 years it (2)………………. very little, ranging between 21 and 22 years, but by 1960 it had fallen to a low of just over 20. However, then it (3) ……………………, rising to 22 in 1980 and 25 in 2000, just two years younger than men, (4)………………… four years in 1900.
The age of marriage for men followed a similar pattern, falling from 26 at the start of the century to a low of just over 22 (5) ……………………. During the last forty years, however, the age jumped (6)…………………, reaching 27 in 2000, one year older on average than at the start of the period.
(7)…………………, men still tend to be older than their partners at marriage, but the difference (8)………………… significantly, and both are marrying later.
----- Nội dung dịch tự động từ ảnh -----
Age
28
27
26
25
24
23
Age of Marriage, USA
22
21
20
1900
1920
1940
1960
1980
2000
Men
Women
shot up dramatically,has fallen,sharply, shows, between 1950 and 1970, compared to,changed, in conclusion
The graph (1)…………….. changes in the average age of marriage for men and women in the USA between 1900 and 2000. Overall, although both men and women are getting married later, the difference between them has decreased.
The biggest change was in the age of marriage for women. For the first 50 years it (2)………………. very little, ranging between 21 and 22 years, but by 1960 it had fallen to a low of just over 20. However, then it (3) ……………………, rising to 22 in 1980 and 25 in 2000, just two years younger than men, (4)………………… four years in 1900.
The age of marriage for men followed a similar pattern, falling from 26 at the start of the century to a low of just over 22 (5) ……………………. During the last forty years, however, the age jumped (6)…………………, reaching 27 in 2000, one year older on average than at the start of the period.
(7)…………………, men still tend to be older than their partners at marriage, but the difference (8)………………… significantly, and both are marrying later.
----- Nội dung dịch tự động từ ảnh -----
Age
28
27
26
25
24
23
Age of Marriage, USA
22
21
20
1900
1920
1940
1960
1980
2000
Men
Women