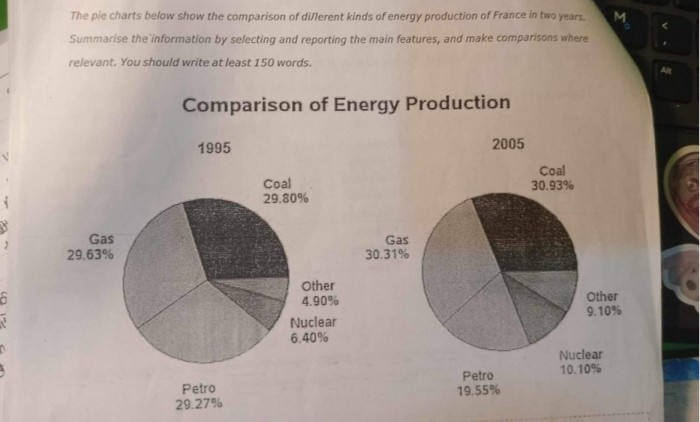
Giúp mik ----- Nội dung dịch tự động từ ảnh ----- V Caps Lock כ 6 K 2 Tra The pie charts below show the comparison of diЛerent kinds of energy production of France in two years. Summarise the information by selecting and reporting the main features, and make comparisons where relevant. You should write at least 150 words. Comparison of Energy Production 1995 Gas 29.63% Petro 29.27% Coal 29.80% Gas 30.31% Other 4.90% Nuclear 6.40% 2005 Coal 30.93% M 0 Other 9.10% Nuclear Petro 19.55% 10.10% 6 Alt