guideline of consuming five or more servings of fruits and vegetables per day across various age brackets in 2006.</p><p>Overall, a greater proportion of females across all age categories adhered to the recommended daily intake of five or more portions of fruits and vegetables. Additionally, the 55-64 age bracket recorded the highest percentages for both genders complying with the WHO’s guidelines for fruit and vegetable consumption.</p><p>The age group of 19-24 years reported the lowest adherence to the recommended fruit and vegetable intake, with 16% for females and 15% for males. Compliance rates consistently escalated in each subsequent age category until reaching a peak in the 55-64 age group.</p><p>In 2006, approximately 35% of females and 32% of males within the 55-64 age range met the WHO’s recommendation of five or more servings of fruits and vegetables per day. The proportions dropped gradually when age ascended, recording around 30% for females and 27% for males adhering to the prescribed intake. Meanwhile, roughly 25% of individuals in each gender aged 75 and above met the WHO’s daily fruit and vegetable recommendation.</p><p>Sample 3:</p><p>The chart shows the percentages of males and females in the UK that consumed the World Health Organisation’s recommendation of five or more portions of fruit and vegetables per day according to different age groups in 2006.</p><p>Overall, it is clear that a higher percentage of females in every age group consumed the recommended five or more portions of fruit and vegetables per day. Furthermore, the highest percentages of men and women who consumed the WHO’s recommendation for fruit and vegetables came from the 55–64-year-old age group.</p><p>In 2006, around 35% of females and 32% of males aged between 55-64 years-old consumed five or more portions of fruit and vegetables per day. This was followed by men and women aged 65-74 years-old, at around 27% and 30% respectively. Meanwhile, around 25% of those aged 75 and above consumed the WHO’s recommended daily intake of fruit and vegetables.</p><p>The lowest percentage of men and women that consumed the daily recommended fruit and vegetable intake came from the 19–24-year-old group, at approximately 15% each. The figures for both men and women continued to increase in each age group up to the 55–64-year-old group.</p><p>Sample 4:</p><p>The bar graph given demonstrates how many British men and women, in 2006, met the World Health Organization's guideline of eating five servings of fruit and vegetables daily.</p><p>Overall, females outperformed males across all age groups among those who followed the World Health Organization's")
In 2006, approximately one-third of males aged between 55 and 64 consumed enough fruit and vegetables daily. This was followed by men and women aged 65-74, at around 5% less. Meanwhile, precisely a quarter of those aged 75 and above consumed the WHO's recommended daily intake of fruit and vegetables.
Regarding the other age groups, as the ages were decreasing, there was a declining trend of people following WHO's recommendation. From the age group 45-54 to 25-34, their proportions fell from roughly 27% (females) and 22% (males) to 22% (females) and 20% (males), respectively. Ultimately, as the figure reached the 19-24-year-old group, the percentage of men and women became lowest, at just approximately 15% each.
" alt="Sample 1:
The bar graph provides the rate of men and women in the UK who included at least five servings of fruit and vegetables into their daily diet in 2006, divided by age cohorts. Overall, there was a general trend of increasing fruit and vegetable consumption with age which peaked at the 55-64 age group for both genders. Additionally, the proportion of females who reached the goal was higher than that of males in most categories, except for the 75 one.
Regarding men, the proportion of residents aged 55-64 consuming five or more portions of fruit and vegetables daily was the highest at approximately 33%, whereas the 19-24 age group had the lowest rate at 15%. People from 25 to 54 shared comparable rates of around 20 to 23%. The figure for the 65–74-year-old bracket made up roughly 28%, about 3% higher than that of elders aged 75.
Concerning women, the 55–64-year-old group ranked 1st at nearly 35%, followed by the 65-74 and 45-54 age cohorts at approximately 30% and 27%, respectively. The shares of the two age groups of 35-54 and 75 were identical at 25%, slightly greater than that of the 25–34-year-olds at roughly 23%. The youngest age profile had the lowest rate of around 15%.
Sample 2:
The provided chart delineates the proportions of males and females in the UK adhering to the World Health Organisation’s (WHO) guideline of consuming five or more servings of fruits and vegetables per day across various age brackets in 2006.
Overall, a greater proportion of females across all age categories adhered to the recommended daily intake of five or more portions of fruits and vegetables. Additionally, the 55-64 age bracket recorded the highest percentages for both genders complying with the WHO’s guidelines for fruit and vegetable consumption.
The age group of 19-24 years reported the lowest adherence to the recommended fruit and vegetable intake, with 16% for females and 15% for males. Compliance rates consistently escalated in each subsequent age category until reaching a peak in the 55-64 age group.
In 2006, approximately 35% of females and 32% of males within the 55-64 age range met the WHO’s recommendation of five or more servings of fruits and vegetables per day. The proportions dropped gradually when age ascended, recording around 30% for females and 27% for males adhering to the prescribed intake. Meanwhile, roughly 25% of individuals in each gender aged 75 and above met the WHO’s daily fruit and vegetable recommendation.
Sample 3:
The chart shows the percentages of males and females in the UK that consumed the World Health Organisation’s recommendation of five or more portions of fruit and vegetables per day according to different age groups in 2006.
Overall, it is clear that a higher percentage of females in every age group consumed the recommended five or more portions of fruit and vegetables per day. Furthermore, the highest percentages of men and women who consumed the WHO’s recommendation for fruit and vegetables came from the 55–64-year-old age group.
In 2006, around 35% of females and 32% of males aged between 55-64 years-old consumed five or more portions of fruit and vegetables per day. This was followed by men and women aged 65-74 years-old, at around 27% and 30% respectively. Meanwhile, around 25% of those aged 75 and above consumed the WHO’s recommended daily intake of fruit and vegetables.
The lowest percentage of men and women that consumed the daily recommended fruit and vegetable intake came from the 19–24-year-old group, at approximately 15% each. The figures for both men and women continued to increase in each age group up to the 55–64-year-old group.
Sample 4:
The bar graph given demonstrates how many British men and women, in 2006, met the World Health Organization's guideline of eating five servings of fruit and vegetables daily.
Overall, females outperformed males across all age groups among those who followed the World Health Organization's "green" dietary guidelines. In addition, for both genders, the percentage was most significant between the ages of 55 and 64.
In 2006, approximately one-third of males aged between 55 and 64 consumed enough fruit and vegetables daily. This was followed by men and women aged 65-74, at around 5% less. Meanwhile, precisely a quarter of those aged 75 and above consumed the WHO's recommended daily intake of fruit and vegetables.
Regarding the other age groups, as the ages were decreasing, there was a declining trend of people following WHO's recommendation. From the age group 45-54 to 25-34, their proportions fell from roughly 27% (females) and 22% (males) to 22% (females) and 20% (males), respectively. Ultimately, as the figure reached the 19-24-year-old group, the percentage of men and women became lowest, at just approximately 15% each.
" src="https://cdn.lazi.vn/timthumb.php?src=storage/uploads/edu/answer/lazi_65927_1736762231.png&w=100" /> 


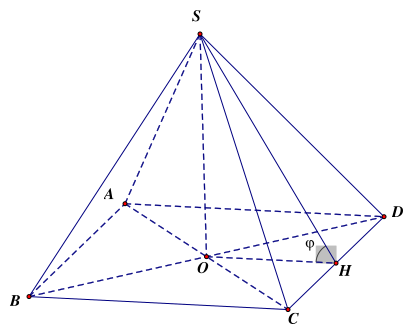
![<p>Hướng dẫn giải</p><p>Gọi \(O\) là giao điểm \(AC\) và \(BD\).</p><p>Vì \(ABCD\) là hình vuông nên \(AC \bot BD\) mà \(SA \bot BD\left( {SA \bot \left( {ABCD} \right)} \right)\) nên \(BD \bot \left( {SAC} \right)\)\( \Rightarrow BD \bot SO\).</p><p>Lại có \(CO \bot BD\), suy ra \(\widehat {SOC}\) là góc phẳng nhị diện \(\left[ {S,BD,C} \right]\).</p><p>Có \(AC = a\sqrt 2 \Rightarrow OC = \frac{{a\sqrt 2 }}{2}\), \(\left( {SC,\left( {ABCD} \right)} \right) = \left( {SC,AC} \right) = \widehat {SCA} = 60^\circ \).</p><p>Xét \(\Delta SAC\) có \(SC = \frac{{\cos \widehat {SCA}}} = \frac{{a\sqrt 2 }}{{\cos 60^\circ }} = 2a\sqrt 2 \), \(SA = AC\tan \widehat {SCA} = a\sqrt 2 .\tan 60^\circ = a\sqrt 6 \).</p><p>Xét \(\Delta SAO\) có \(SO = \sqrt {S{A^2} + A{O^2}} = \sqrt {6{a^2} + \frac{{{a^2}}}{2}} = \frac{{a\sqrt {26} }}{2}\).</p><p>Xét \(\Delta SOC\) có \(\cos \widehat {SOC} = \frac{{S{O^2} + O{C^2} - S{C^2}}} = \frac{{\frac{{{a^2}.26}}{4} + \frac{{2{a^2}}}{4} - 8{a^2}}}{{2.\frac{{a\sqrt {26} }}{2}.\frac{{a\sqrt 2 }}{2}}} = \frac{{ - 1}}{{\sqrt {13} }}\)\( \Rightarrow \widehat {SOC} \approx 106^\circ \).</p>](https://cdn.lazi.vn/storage/uploads/edu/answer/lazi_9142_1736761789.png "<p>Hướng dẫn giải</p><p>Gọi \(O\) là giao điểm \(AC\) và \(BD\).</p><p>Vì \(ABCD\) là hình vuông nên \(AC \bot BD\) mà \(SA \bot BD\left( {SA \bot \left( {ABCD} \right)} \right)\) nên \(BD \bot \left( {SAC} \right)\)\( \Rightarrow BD \bot SO\).</p><p>Lại có \(CO \bot BD\), suy ra \(\widehat {SOC}\) là góc phẳng nhị diện \(\left[ {S,BD,C} \right]\).</p><p>Có \(AC = a\sqrt 2 \Rightarrow OC = \frac{{a\sqrt 2 }}{2}\), \(\left( {SC,\left( {ABCD} \right)} \right) = \left( {SC,AC} \right) = \widehat {SCA} = 60^\circ \).</p><p>Xét \(\Delta SAC\) có \(SC = \frac{{\cos \widehat {SCA}}} = \frac{{a\sqrt 2 }}{{\cos 60^\circ }} = 2a\sqrt 2 \), \(SA = AC\tan \widehat {SCA} = a\sqrt 2 .\tan 60^\circ = a\sqrt 6 \).</p><p>Xét \(\Delta SAO\) có \(SO = \sqrt {S{A^2} + A{O^2}} = \sqrt {6{a^2} + \frac{{{a^2}}}{2}} = \frac{{a\sqrt {26} }}{2}\).</p><p>Xét \(\Delta SOC\) có \(\cos \widehat {SOC} = \frac{{S{O^2} + O{C^2} - S{C^2}}} = \frac{{\frac{{{a^2}.26}}{4} + \frac{{2{a^2}}}{4} - 8{a^2}}}{{2.\frac{{a\sqrt {26} }}{2}.\frac{{a\sqrt 2 }}{2}}} = \frac{{ - 1}}{{\sqrt {13} }}\)\( \Rightarrow \widehat {SOC} \approx 106^\circ \).</p>")