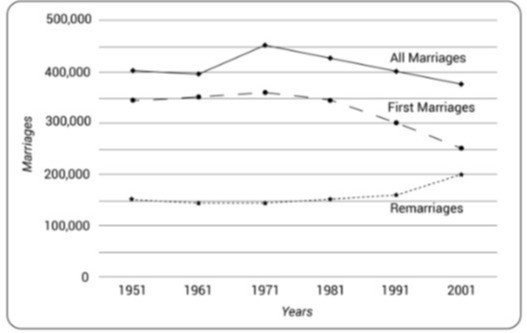
Bài tập  /  Bài đang cần trả lời

The graph shows information about the number of marriages in the UK from 1951 to 2001

<audio class="audio-for-speech" src=""> </audio><div class="translate-tooltip-mtz translator-hidden">

Viết câu miêu tả xu hướng bằng động từ cho biểu đồ sau.

The graph shows information about the number of marriages in the UK from 1951 to 2001.

1. Miêu tả số liệu và xu hướng của First Marriages giai đoạn từ 1951 đến 1971.

2. Miêu tả số liệu và xu hướng của First Marriages giai đoạn từ 1971 đến 2001.

3. Miêu tả số liệu và xu hướng của Remarriages giai đoạn từ 1951 đến 1991.

4. Miêu tả số liệu và xu hướng của Remarriages giai đoạn từ 1991 đến 2001.

5. Miêu tả số liệu và xu hướng của All marriages giai đoạn từ 1951 tới 1961.

6. Miêu tả số liệu và xu hướng của All marriages giai đoạn từ 1961 tới 2001.


----- Nội dung ảnh -----
Nội dung trong bức ảnh mô tả một biểu đồ thể hiện số lượng hôn nhân theo năm, với các dòng đại diện cho "Tất cả các hôn nhân", "Hôn nhân lần đầu" và "Hôn nhân lại". Các năm được đánh dấu từ 1951 đến 2001, và số lượng hôn nhân được ghi trên trục dọc.
1 trả lời
Hỏi chi tiết
5
Tham khảo câu trả lời từ Trợ lý ảo Lazi
The graph illustrates the trends in marriages in the UK from 1951 to 2001, categorized into three groups: all marriages, first marriages, and remarriages.

1. **All Marriages**: The total number of marriages fluctuates, peaking around the early 1970s at approximately 450,000, then showing a gradual decline towards 2001.

2. **First Marriages**: This category shows a general decrease over the years, starting at about 400,000 in 1951 and dropping to below 300,000 by 2001, indicating a decline in the occurrence of first marriages.

3. **Remarriages**: In contrast, remarriages display an increasing trend over the same period, starting from around 100,000 and rising to approximately 200,000 by 2001. This suggests that while first marriages are declining, the rate of remarriages is increasing.

Overall, the data highlights shifting trends in marriage patterns within the UK over the 50-year span.
0
0
Diệp Anh
hôm qua
+5đ tặng
1.
 
The number of first marriages fell from about 300,000 to about 250,000.
 
First Marriages fell from about 300,000 to about 250,000 between 1951 and 1971.
 
2.
 
The number of first marriages remained stable, hovering around 250,000.
 
First Marriages remained stable, hovering around 250,000 between 1971 and 2001.
 
3.
 
The number of remarriages increased from about 50,000 to about 90,000.
 
Remarriages increased from about 50,000 to about 90,000 between 1951 and 1991.
 
4.
 
The number of remarriages remained stable, hovering around 90,000.
 
Remarriages remained stable, hovering around 90,000 between 1991 and 2001.
5.
 
The number of marriages fell from about 400,000 to about 350,000.
 
All marriages fell from about 400,000 to about 350,000 between 1951 and 1961.*
 
6.
 
The number of marriages fell from about 350,000 to about 300,000, then rose to about 400,000, and finally fell back to about 350,000.
 
All marriages fell from about 350,000 to about 300,000, then increased to about 400,000, and finally fell to about 350,000 between 1961 and 2001.
 

Mở khóa để xem toàn bộ nội dung trả lời

(?)
Bạn đã đạt đến giới hạn của mình. Bằng cách Đăng ký tài khoản, bạn có thể xem toàn bộ nội dung trả lời
Cải thiện điểm số của bạn bằng cách đăng ký tài khoản Lazi.
Xem toàn bộ các câu trả lời, chat trực tiếp 1:1 với đội ngũ Gia sư Lazi bằng cách Đăng nhập tài khoản ngay bây giờ
Tôi đã có tài khoản? Đăng nhập

Bạn hỏi - Lazi trả lời

Bạn muốn biết điều gì?

GỬI CÂU HỎI
Học tập không giới hạn cùng học sinh cả nước và AI, sôi động, tích cực, trải nghiệm

Hôm nay bạn thế nào? Hãy nhấp vào một lựa chọn, nếu may mắn bạn sẽ được tặng 50.000 xu từ Lazi

Vui Buồn Bình thường

Học ngoại ngữ với Flashcard

×
Gia sư Lazi Gia sư
×
Trợ lý ảo Trợ lý ảo