Bài tập  /  Bài đang cần trả lời

Làm bài số liệu

a. March – July
...........................................................................................................................................................
b. July – October ...........................................................................................................................................................
c. October – November ...........................................................................................................................................................
----- Nội dung dịch tự động từ ảnh -----
Exercise 3. Describe the graph by periods of time
The line graph shows estimated sales of gold in Dubai for 12 months in 2002 (in millions of
Dirhams)
Millions of Dirhams
400
350
300
250
200
150
100
50
0
Jan
Feb
Mar Apr May Jun Jul Aug Sep Oct Nov Dec
2 trả lời
Hỏi chi tiết
26
1
0
Thợ Săn Anh Hùng
24/06 21:16:51
+5đ tặng
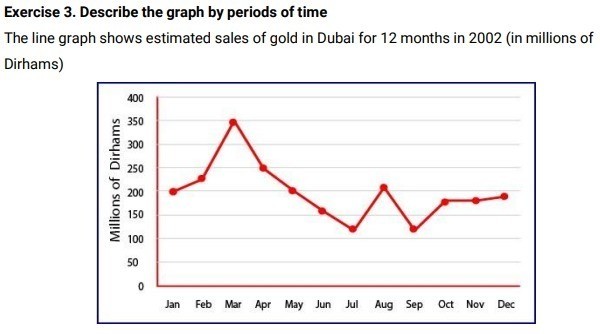
The line graph gives information about gold trade in Dubai from January to December of the year 2002.

It is clear in the graph that the gold sales reached its highest level of selling in March and it fell to its lowest level between July and September.

In the beginning of the year the gold price stood at 200 millions of dirhams and it increased slightly in the following month before the figures showed a sharp rise in March, with the selling was about 350 million of dirhams.

In contrast, after the trend reached a peak in March with its highest gold trading, the figures decreased gradually for the next 4 months from April, May, June and July with 250, 200, 150, and 120 million of dirhams, respectively. Surprisingly enough, there was a strong recovery for the Dubai gold sales in August with the selling was about 200 million of dirhams and it fluctuated before it was levelling off until the end of the year and the trading closed nearly 200 million of dirhams in December.

Mở khóa để xem toàn bộ nội dung trả lời

(?)
Bạn đã đạt đến giới hạn của mình. Bằng cách Đăng ký tài khoản, bạn có thể xem toàn bộ nội dung trả lời
Cải thiện điểm số của bạn bằng cách đăng ký tài khoản Lazi.
Xem toàn bộ các câu trả lời, chat trực tiếp 1:1 với đội ngũ Gia sư Lazi bằng cách Đăng nhập tài khoản ngay bây giờ
Tôi đã có tài khoản? Đăng nhập
1
0
Cow
24/06 21:16:53
+4đ tặng

a. The upward trend in March was suddenly broken and sales declined dramatically over the next 4 months to reach a little over 100 million in july

b. There was a fluctuantion from July to October

c. A marginal growth in Dubai gold sales between October and November

Bạn hỏi - Lazi trả lời

Bạn muốn biết điều gì?

GỬI CÂU HỎI
Học tập không giới hạn cùng học sinh cả nước và AI, sôi động, tích cực, trải nghiệm

Hôm nay bạn thế nào? Hãy nhấp vào một lựa chọn, nếu may mắn bạn sẽ được tặng 50.000 xu từ Lazi

Vui Buồn Bình thường

Học ngoại ngữ với Flashcard

×
Gia sư Lazi Gia sư
×
Trợ lý ảo Trợ lý ảo